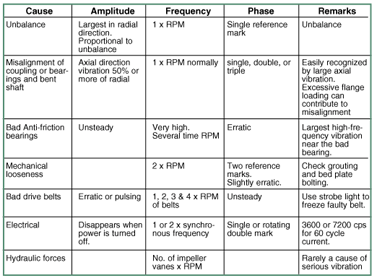
For example, assume the axial vibration is 50% or more of the radial vibration and the predominant frequency is the same as the RPM of the pump. The chart indicates probable misalignment or bent shaft. Coupling misalignment is probably the most common single cause of pump vibration and is one of the easiest to check. If after checking, the alignment proves to be good, then inspect for flange loading. Finally, check for a bent shaft. Cavitation in a pump can cause serious vibration. Vibration at random frequencies can also be caused by hydraulic disturbances in poorly designed suction or discharge systems.
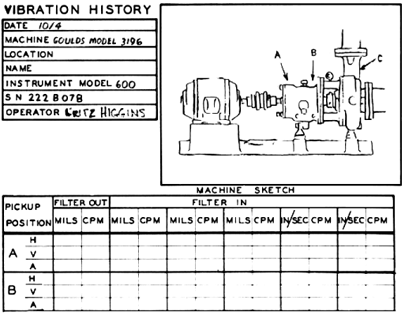
The use of vibration equipment in preventative maintenance involves keeping a vibration history on individual pieces of equipment in a plant. A form similar to that shown in Fig 3 can be used to record the vibration data on a periodic routine basis. Abrupt changes are a sign of impending failure. A gradual increase in vibration can also be detected and corrective measures can be taken before it reaches a dangerous level.
 Fig. 3 Vibration Identification Chart
 Fig. 4 Vibration Data Sheet

